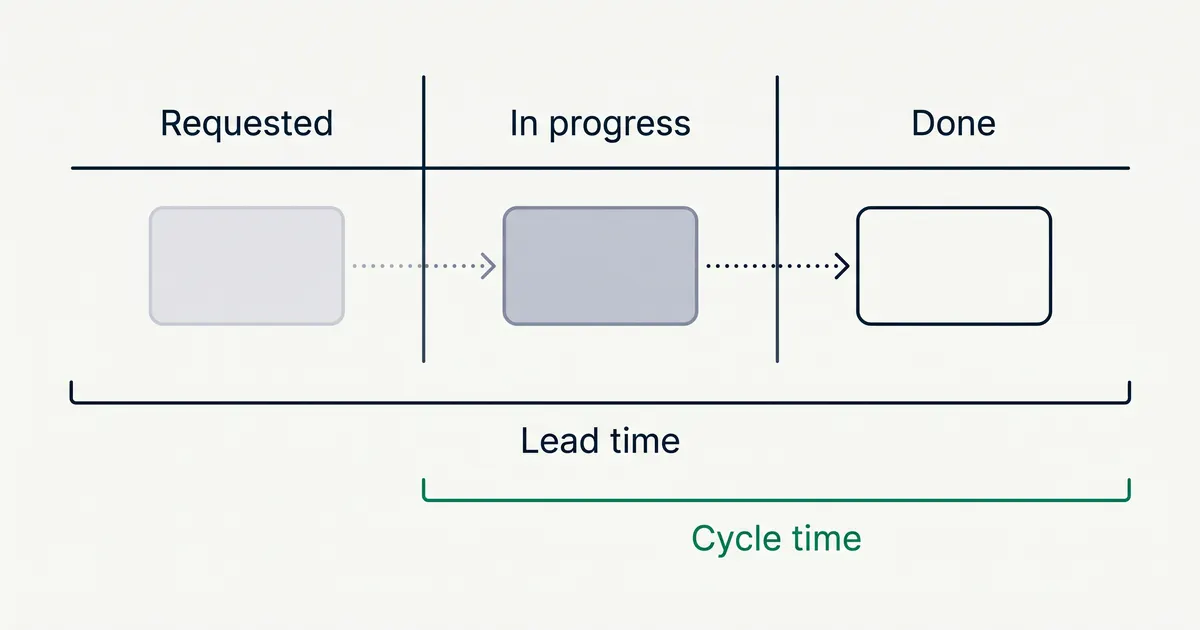
Lead time is the time from a request to its delivery, and cycle time is the time from the start of work to its finish. In tools that measure both, such as Azure DevOps and Jira’s control chart, cycle time is the shorter span inside lead time. Each source sets the start and end points in a different place, so two teams can report different numbers for the same card.
This guide shows where the definitions differ, works through one card with real dates, and then covers the other kanban metrics: throughput, WIP, work item age, Little’s Law, cumulative flow diagrams and percentile forecasts. It ends with what KanbanWP, our own plugin, reports and what it does not.
Lead time vs cycle time: the short answer
| Lead time | Cycle time | |
|---|---|---|
| Starts | When the request is made, or when the team commits to it | When work on the item starts |
| Ends | When the item is finished or delivered | When the item is finished |
| Includes waiting before work starts | Yes | No |
| Answers | How long does a customer wait? | How long does the team take once it starts? |
In factories the words mean something else. The Lean Enterprise Institute defines cycle time as “the time required to produce a part or complete a process, as timed by actual measurement.” Production lead time is the time a product takes to move through the whole production process. Order lead time is production lead time plus the time to get the product to the customer. Takt time is a third term: available production time divided by customer demand. A plant that runs 480 minutes a day for 240 widgets has a takt time of two minutes.
Why the definitions disagree
The two terms come from manufacturing, and each software and kanban source has adapted them in its own way. This table shows how six sources define them.
| Source | Lead time | Cycle time |
|---|---|---|
| Kanban Guide (ProKanban, May 2025 edition) | Not used | From when a work item started to when it finished |
| Kanban University guide | From the commitment point to completion | Not used |
| Azure DevOps | From when a work item is created until it reaches a Completed state | From when it first enters an In Progress state until it reaches a Completed state |
| Jira control chart | From when the issue is logged until work is completed | The time spent in the columns you select |
| Jira cycle time report | Not used | From the first commit until the code is shipped |
| DORA | Change lead time: from a commit to version control until the change is deployed in production | Not used |
The Kanban Guide published at kanbanguides.org uses only cycle time, and it adds that the metric may go by other names, such as flow time. Kanban University’s guide uses only lead time. Both guides start the clock when the team commits to or starts the item, not when someone first asks for it.
Azure DevOps starts lead time when the work item is created, so lead time there includes time in the backlog. In Jira’s control chart, you pick the columns that count, so the same chart can show cycle time or lead time. Jira’s cycle time report measures only the code part of the work, from first commit to release, which is close to DORA’s change lead time.
None of these definitions is wrong, but before you compare your number with another team’s or a vendor’s, check where each clock starts and stops.
A worked example: one card, four numbers
A client asks for a new pricing page. Here is the card’s history on a board with the stages Backlog, Ready, In progress, Review and Done.
- Tuesday, September 1: the request arrives and the card is created in Backlog.
- Tuesday, September 8: the team commits to it in the weekly planning meeting and moves it to Ready.
- Thursday, September 10: a writer starts work and moves it to In progress.
- Monday, September 14: the draft goes to Review and waits for the client.
- Thursday, September 17: the client approves and the card moves to Done.
- Monday, September 21: the page is published on the client’s site.
The same card gives four different numbers, counted in calendar days:
| Measure | From | To | Days |
|---|---|---|---|
| Customer lead time (request to delivery) | September 1 | September 21 | 20 |
| Lead time in Azure DevOps (created to completed) | September 1 | September 17 | 16 |
| Lead time in Kanban University’s guide (commitment to completion) | September 8 | September 17 | 9 |
| Cycle time in the Kanban Guide and Azure DevOps (started to finished) | September 10 | September 17 | 7 |
The 7-day cycle time includes the three days the draft waited for the client in Review. Cycle time is elapsed time, not hours of effort, so waiting inside the started stages counts.
Some teams count both the first and the last day, which would make the cycle time 8 days. Either rule works if you apply it to every card.
Throughput, WIP and work item age
The Kanban Guide names four flow measures. Cycle time is one of them, and the other three are:
- Work in progress (WIP): “The number of work items started but not finished.” On the example board, that is every card in In progress and Review.
- Throughput: “The number of work items finished per unit of time.” The guide says it is an exact count of items, not points or hours. A team that finishes 12 cards in four weeks has a throughput of 3 cards a week.
- Work item age: “The elapsed time between when a work item started and the current date.” On Tuesday, September 15, the pricing page card had an age of 5 days.
Of the four, only work item age describes a single card that is still in progress. Cycle time is known only once the card reaches Done, while age tells you which cards are getting old now, so the team can unblock or split them. The Kanban Guide asks teams to make sure “work items do not age unnecessarily.”
Little’s Law and its assumptions
Little’s Law links WIP, throughput and cycle time. John D. C. Little proved it in 1961 and reviewed it in 2011. In his notation, L = λW: the average number of items in a system (L) equals the average arrival rate (λ) multiplied by the average time each item spends there (W).
On a kanban board, the same law reads:
Average cycle time = average WIP ÷ average throughput
A team that keeps 6 cards in progress and finishes 3 cards a week has an average cycle time of 2 weeks. If the team cuts WIP to 3 cards and still finishes 3 a week, the average falls to 1 week, which is the reason kanban limits WIP.
The law holds only under certain conditions. Daniel Vacanti, a contributor to the Kanban Guide, lists five assumptions for the period you measure:
- The average departure rate equals the average arrival rate.
- All items that enter the system finish and leave it.
- WIP is roughly the same at the start and at the end of the period.
- The average age of WIP is neither growing nor falling.
- Throughput, cycle time and WIP are measured in matching units, for example cards, days and cards per day.
If cards pile up faster than the team finishes them, or the team abandons cards without closing them, the formula gives a wrong answer. Little also wrote that the formula, applied to a period that has already ended, is in “the measurement business, not the forecasting business.” It describes averages for a period that has already happened. It does not tell you when a single card will finish.
Average vs 85th percentile for forecasting
To answer “when will this card be done?”, use percentiles of past cycle times instead of the average. Here are the cycle times, in days, for the last 20 cards a team finished, sorted:
1, 2, 2, 3, 3, 3, 4, 4, 4, 5, 5, 5, 6, 6, 7, 8, 9, 12, 15, 21
- The average is 6.25 days. The single 21-day card pulls it up, and the average says nothing about how often a card takes longer.
- The median (50th percentile) is 5 days. Half the cards finished in 5 days or less.
- The 85th percentile is 9 days. Seventeen of the 20 cards, which is 85%, finished in 9 days or less.
The 85th percentile turns history into a statement you can give a client: “85% of our cards finish within 9 days of starting.” The Kanban Guide calls this a service level expectation (SLE), and its own example is “85% of work items will be finished in eight days or less.” An SLE has two parts, a number of days and a probability.
The SLE also works with work item age. For the team above, a card that is 7 days old is close to the 9-day mark and needs attention before it passes it.
Azure DevOps suggests a different method. Its guidance uses the average and the standard deviation: with an average cycle time of 8 days and a standard deviation of 6 days, it estimates delivery 2 to 14 days after work begins. In the 20-card sample earlier in this section, the 21-day card makes the average (6.25 days) higher than the median (5 days), which is why a percentile is easier to state as a promise.
Charts for flow metrics
The Kanban Guide does not require any chart. Jira and Azure DevOps both offer the two charts below.
Cumulative flow diagram
A cumulative flow diagram (CFD) is a stacked area chart with one band per stage. Time runs along the horizontal axis and the number of items along the vertical axis. Microsoft’s CFD guidance describes two patterns:
- Flat lines across many bands mean nobody updated the board, or work stopped across the whole process.
- Bulges in one band mean work is building up in that stage. The guidance notes that a bulge often points to a problem in the next step, not in the stage that bulges.
The vertical height of the bands between the start and finish stages shows WIP on that day. Atlassian’s Jira CFD page adds that a band widening over time is usually a bottleneck.
Cycle time scatter plot and control chart
A scatter plot puts one dot per finished item, with the finish date on the horizontal axis and the cycle time on the vertical axis. Dots far above the rest are outliers, and Microsoft’s guidance says outliers often point to a problem in the process.
Jira’s control chart and Azure DevOps’s Lead Time and Cycle Time widgets are scatter plots of this kind. Both tools draw an average line that moves with time, plus a standard deviation band that shows how far typical cycle times spread around that line.
How to measure lead time and cycle time in Jira and Azure DevOps
Jira (company-managed spaces). Open the control chart from your board’s reports. Select the columns that count as work, for example In progress and Review, to get cycle time. Add the earlier columns to get lead time. The chart shows each issue as a dot with a rolling average and a standard deviation band. Atlassian’s separate cycle time report needs a connected CI/CD pipeline and measures from first commit to deployment.
Azure DevOps. Add the Cycle Time or Lead Time widget to a dashboard. Pick the team, the backlog level and a rolling period in days. The widget shows a scatter plot, the average in days, a moving average and a standard deviation band. A reopened item’s cycle time runs from its first In Progress state to its last Completed state.
Neither tool shows the 85th percentile on these charts. To get it, export the finished items and their dates to a spreadsheet and use a percentile function such as PERCENTILE.INC.
What KanbanWP reports
KanbanWP is our own WordPress kanban plugin. Its Reports screen covers one board at a time and shows:
- Avg cycle time (days): the average time from when a task was created to when it was completed, across the board’s completed tasks. A task gets its completion date when it moves into the board’s last stage, and loses it if it moves out again.
- Completed this week: tasks completed in the last seven days, which is your throughput for that week.
- A count of tasks in each stage, which is the current WIP per stage.
- Cumulative flow (last 30 days): a stacked area chart with one band per stage, rebuilt from task creation dates and the stage moves in the board’s activity log.
- Workload: open, overdue and due-this-week tasks for each board member.
Archived tasks are left out of these figures.
Stage headers on the board show the card count against the stage’s WIP limit, such as 3/5. Above the limit the count turns red, but moves are not blocked. See WIP limits.
KanbanWP’s average cycle time starts when the task is created, not when work starts. By the definitions above, it matches Azure DevOps’s lead time more closely than the Kanban Guide’s cycle time. If tasks are created the moment a request arrives, for example from a form, the number is close to what your client waits.
KanbanWP does not show:
- a cycle time measured from the start of work,
- work item age,
- percentiles or a service level expectation,
- a cycle time scatter plot or control chart,
- time spent in each stage.
You can calculate these yourself from the data KanbanWP keeps:
- The JSON board export from Import and export includes each task’s creation and completion dates, which is enough to calculate created-to-done times and their percentiles in a spreadsheet.
- A webhook on the “Task moved” event sends the task, the old and new stage IDs and a timestamp for every move. Log those events and you have the start date of each card, which gives cycle time from the start of work and work item age.
- The Export CSV button on the Reports screen saves the overview cards and stage counts, so you can keep a weekly record of throughput and WIP.
Frequently asked questions
What is the difference between lead time and cycle time?
Lead time measures the wait the customer sees, from the request or commitment to completion. Cycle time measures how long the team took, from the start of work to completion. In Azure DevOps and Jira, cycle time is the shorter span inside lead time.
Is cycle time part of lead time?
In Azure DevOps, yes, and in Jira's control chart when you select the matching columns. Lead time starts when the item is created or committed, and cycle time starts later, when work begins. Lead time and cycle time end when the item is finished.
Does the Kanban Guide use lead time?
No. The Kanban Guide published at kanbanguides.org names four measures: WIP, throughput, work item age and cycle time. Kanban University's guide uses lead time, measured from the commitment point to completion.
How do you calculate cycle time?
Subtract the date work started from the date it finished. A card started on September 10 and finished on September 17 has a cycle time of 7 days. Decide whether you count the start day, and use the same rule for every card.
What does Little's Law say about kanban?
Little's Law says that average WIP equals throughput multiplied by average cycle time over the same period. A team with 6 cards in progress that finishes 3 cards a week has an average cycle time of 2 weeks. The law holds only when the flow is stable, and it describes the past rather than forecasting single items.
Why use the 85th percentile instead of the average cycle time?
A few slow cards pull the average up, and the average says nothing about how likely a date is. The 85th percentile tells you that 85% of past cards finished within that many days, which you can quote as a forecast.